Quick answer: A plastic recycling line’s simple payback is calculated by dividing installed project investment by annual operating cash contribution. But the number is only as honest as its inputs. If the model uses rated capacity instead of saleable output, assumes perfect yield, ignores downtime and reject disposal, and treats working capital as free, the payback period will be systematically shorter than what the project actually delivers. A defensible payback model starts with a mass balance, prices every capital and operating item, and tests the result under conservative utilization and yield assumptions.
What the Simple Payback Formula Actually Says
The basic formula used across equipment investment screening is straightforward:
Simple payback (months) = installed project investment ÷ annual operating cash contribution × 12
And the companion ROI expression is:
Simple annual ROI = annual operating cash contribution ÷ installed project investment × 100%
These formulas are useful for a first screen, but they are not a feasibility study. They compress every operating reality into two numbers: how much cash the project generates in a year, and how much capital goes in before the first saleable kilogram leaves the gate. The problem is not the arithmetic. The problem is what gets left out of each number.
Where the Denominator Gets Distorted: Saleable Output vs Rated Capacity
The most common modeling error is treating rated throughput as if it were saleable output. A line rated at 500 kg/h does not deliver 500 kg/h of pellets that a buyer will accept and pay for. Between the feed hopper and the packing station, material is lost to:
- Moisture — especially in washing lines and film feedstock;
- Contamination — labels, caps, metals, sand, mixed polymers and fines that must be removed;
- Fines and dust — generated during size reduction and conveying;
- Reject material — pellets or flakes that fail filtration, color or moisture specifications;
- Startup and shutdown losses — off-spec material during heating, purging and die changes.
Industry data illustrate the scale. In typical PP recycling from household packaging waste, an overall PP yield of around 85 wt% based on pure PP input has been reported, with the largest losses occurring at mechanical dryer steps and in the wet grinder. For post-consumer flexible plastics, process yields in the 64%–66% range have been documented for conventional mechanical recycling, with higher recovery achievable for transparent monolayer streams but significantly lower for colored multilayer streams. A separate study of inefficient filtration and low capacity utilization reported raw material losses up to 15%, installed capacity utilization around 70%, and 20% of pellets falling outside specifications.
The modeling implication is direct: annual saleable output = rated throughput × scheduled hours × utilization × product yield. If utilization is 85% and yield is 80%, a 500 kg/h line scheduled for 8 hours a day, 300 days a year does not produce 1,200 tonnes. It produces 816 tonnes of saleable output. Every downstream revenue and cost-per-tonne figure must be built on that 816-tonne base, not on the nameplate number.
| Modeling input | What buyers often use | What a realistic model uses | Effect on payback |
|---|---|---|---|
| Throughput | Rated capacity (e.g., 500 kg/h) | Rated capacity × utilization (e.g., 85%) | Understates required operating hours |
| Output basis | Gross production | Saleable output after yield loss and rejects | Overstates revenue and understates cost per tonne |
| Operating days | 330–350 days | 280–300 days, adjusted for maintenance and changeovers | Shortens the calendar payback |
| Yield | 95%–100% | 75%–85% for many post-consumer streams; higher for clean post-industrial | Understates feedstock required per saleable tonne |
Where the Numerator Gets Distorted: Installed Investment Is Not Equipment Price
Installed project investment includes far more than the machinery quotation. A defensible CAPEX build-up for a plastic recycling line should include:
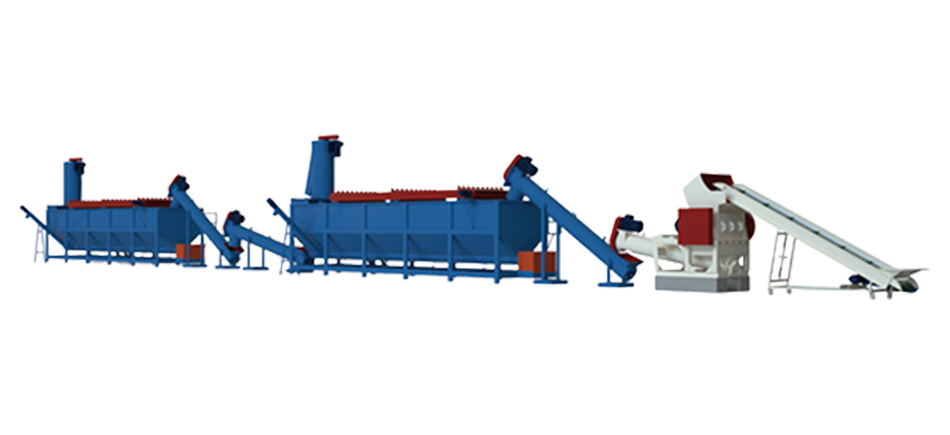
- Process equipment — sorting, size reduction, washing, separation, drying, pelletizing and controls;
- Ancillary equipment — conveyors, buffers, filters, reject handling, water treatment and exhaust treatment;
- Freight and logistics — shipping, inland transport, insurance and customs;
- Installation and commissioning — mechanical and electrical installation, piping, wiring, commissioning labor and travel;
- Civil work and utilities — foundations, flooring, drainage, power distribution, water supply and compressed air;
- Development costs — feed trials, engineering, permits, laboratory work and professional fees;
- Working capital — feedstock inventory, payroll during ramp-up, utilities, receivables and contingency;
- Startup inventory and spares — first fill of wear parts, screens, blades and filtration media.
A useful reference from PVC recycling cost analysis shows how dramatically the total exceeds equipment alone: for a washing and separation line in the 1,000–5,000 t/year range, equipment CAPEX runs roughly $80,000–$250,000, but facility setup adds $50,000–$100,000, bringing total estimated CAPEX to $130,000–$350,000. For a complete line to compounded pellets in the 5,000–15,000 t/year range, total estimated CAPEX reaches $250,000–$500,000+. Maintenance alone typically runs 5%–10% of equipment CAPEX per year, and PVC-type corrosive streams trend toward the upper end.
For rigid plastic recycling lines more broadly, investment ranges of $80,000–$900,000+ have been reported depending on capacity and configuration. These are ranges, not quotations — but they illustrate why “machine price” is not a payback denominator.
The Full OPEX List That Belongs in the Model
Operating cash contribution is revenue minus all costs that vary with production and all fixed costs that exist because the line exists. A practical cost list for a plastic recycling line includes:
| Cost category | What to include | Common modeling omission |
| Feedstock | Delivered cost per kg, including transport, sorting loss and moisture | Treating cheap waste as free after sorting |
| Electricity | Actual kWh per saleable tonne × local tariff | Using installed motor power at 100% load |
| Labor | Operators, sorters, QC, forklift, maintenance and supervision, loaded with payroll costs | Counting only machine operators |
| Water and wastewater | Make-up water, heating, chemicals, sludge handling and discharge fees | Counting water purchase but not treatment |
| Wear parts and maintenance | Blades, screens, filters, heaters, bearings, belts and planned service | Assuming warranty covers routine wear |
| Consumables and QC | Packaging, filtration media, testing, additives and labels | Using gross output instead of saleable output |
| Reject disposal | Reject mass × disposal or treatment rate | Treating contamination as a free material loss |
| Downtime | Lost contribution during cleaning, changeovers, failures and maintenance | Assuming every scheduled hour is productive |
| Outbound logistics | Packaging, palletizing, transport to buyer | Leaving logistics outside the contribution margin |
This structure follows the contribution-margin logic used in recycling feasibility work: contribution per saleable tonne = product revenue + by-product revenue − feedstock − sorting and disposal − utilities − labor − consumables − packaging − variable maintenance − outbound logistics. Break-even volume is then fixed monthly cost divided by contribution per saleable tonne — and payback is installed investment divided by annual contribution.
A More Defensible Way to Express Payback
Instead of one payback number, build three:
- Base case — normal yield, normal utilization, local utility and labor costs, current selling price for the target pellet grade.
- Conservative case — yield 5–10 percentage points lower, utilization 10–15 points lower, selling price at the lower end of the recent range, and an extra month of ramp-up.
- Upside case — higher yield from clean feedstock, higher utilization, and premium pricing for consistent quality.
The conservative case is the number that should be used for internal approval. The base case is the operating target. The upside case is not a promise; it is a sensitivity check.
A published worked example illustrates the arithmetic without pretending to be a quotation: for a 500 kg/h PP/PE line running 8 hours/day, 300 days/year at 85% utilization and 80% saleable yield, annual saleable output is 816,000 kg; at an average selling price of $0.80/kg, revenue is $652,800. With an installed project investment of $300,000, the payback depends entirely on the operating cost stack subtracted from revenue. If the model forgets wear parts, reject disposal or working capital, the payback shrinks by months — on paper only.
A Buyer’s Checklist Before Accepting a Payback Number
- The model uses saleable output, not rated capacity, as the revenue base.
- Yield is based on a representative feedstock trial or a documented material balance, not a supplier’s best-case claim.
- Utilization reflects realistic operating hours after maintenance, changeovers and cleaning.
- CAPEX includes freight, installation, civil work, utilities, commissioning, spares and working capital.
- OPEX includes reject disposal, wastewater treatment and outbound logistics.
- Wear parts are priced from a maintenance schedule, not assumed to be covered by warranty.
- The model shows payback in months under a conservative case, not only a base case.
- Ramp-up time and off-spec production during commissioning are treated as a cash cost, not ignored.
What This Means for Line Configuration
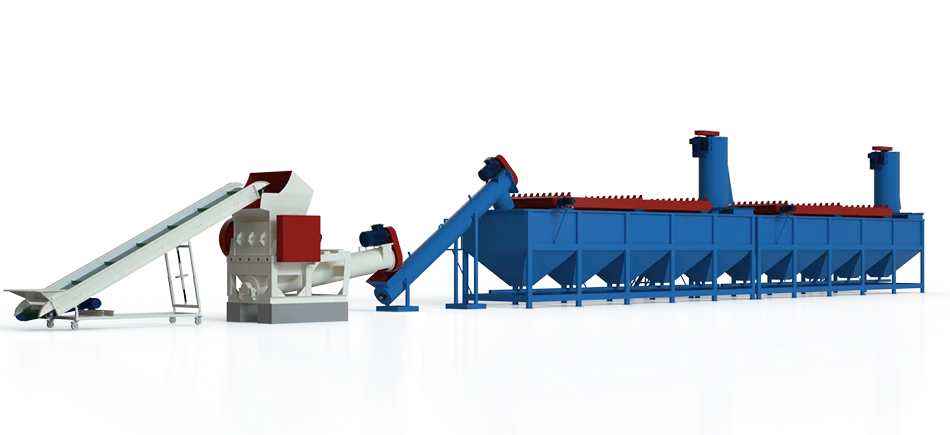
The payback model and the line configuration are not separate decisions. They feed each other. A line configured for a narrow, consistent feedstock — for example, a dedicated film line for PE/PP film or a rigid pelletizer for sorted PP/PE/PS/ABS regrind — can support higher yield and utilization assumptions because the process is matched to the material. A line expected to handle mixed or heavily contaminated feedstock needs more sorting, washing, filtration and reject handling, which raises CAPEX and OPEX per saleable tonne.
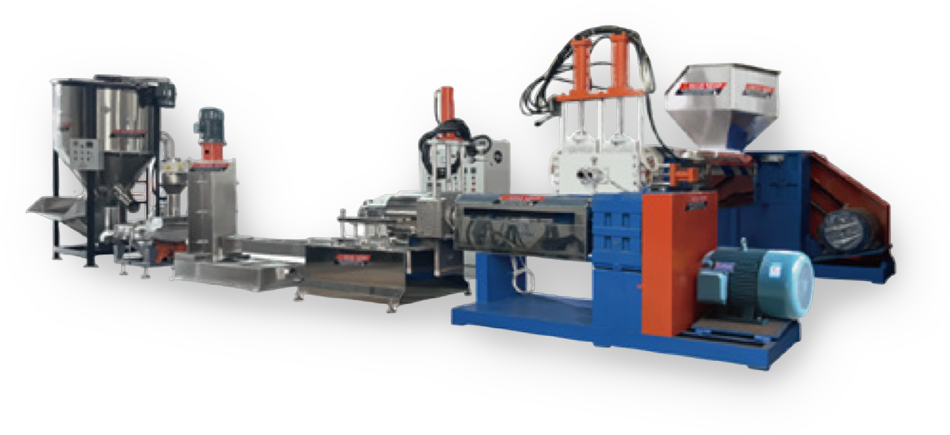
This is why the most useful next step is not another payback calculator, but a material and configuration review. The same installed investment can produce very different saleable output depending on how the pretreatment, feeding, extrusion, filtration, degassing and pellet cutting stages are matched to the actual feedstock and target pellet specification. Reviewing the application-specific solution path is more valuable than optimizing a spreadsheet in isolation.
FAQ
Does a shorter simple payback always mean a better project?
No. A short simple payback can be produced by optimistic yield, rated capacity and an incomplete CAPEX denominator. A slightly longer payback built on a mass balance and full cost stack is more decision-useful because it reflects what the plant will actually cash-flow.
What yield should I use if I do not have a feedstock trial?
Use a conservative published range for the material stream and adjust downward for contamination and moisture. For mixed or post-consumer flexible plastics, documented process yields have been in the 64%–66% range, while cleaner PP streams have reported around 85%. Treat these as starting points for sensitivity analysis, not guarantees.
Is working capital really part of payback?
Yes. Feedstock inventory, payroll during ramp-up, receivables and contingency are cash that must be committed before steady-state contribution begins. Excluding them understates the capital at risk and shortens the calculated payback. Working capital belongs in the installed project investment denominator.
How does downtime affect payback more than it appears?
Downtime reduces saleable output, which reduces revenue, while fixed costs — rent, supervision, insurance, finance — continue. The contribution lost during downtime is therefore larger than the hourly throughput number suggests. A model that uses 330 operating days instead of 280 can easily understate payback by several months.
Should I use IRR or NPV instead of payback?
Payback is a screening tool, not a final investment decision. A final case should also include financing, taxes, depreciation, replacement capital, inflation and the time value of money through NPV or IRR. Payback is useful because it is transparent and easy to audit; it should not be the only metric.
What is the most common reason a recycling line misses its projected payback?
The most common reason is not the machine itself. It is a mismatch between the feedstock actually available and the feedstock assumed in the model, combined with an OPEX list that omits reject disposal, wastewater treatment and wear-part replacement. Configuration review against representative feedstock reduces this risk before capital is committed.
Conclusion
The most important judgment in a plastic recycling line payback calculation is not the formula. It is whether the denominator uses saleable output after yield loss and downtime, and whether the numerator includes working capital and full installed cost, not just the equipment quotation. Avoid the common error of presenting a single optimistic payback number without a conservative case and a documented material balance. When feedstock variability, contamination or output specification is uncertain, technical confirmation against representative samples is the right next step — not a tighter spreadsheet. Buyers can review how line configuration is matched to material and cost-control requirements through the application solution path, and discuss installation, training and wear-part planning through the service and support channel before finalizing the financial model.


 Download
Manual
 Video




 Connect: